See which items to push, fix, or drop.
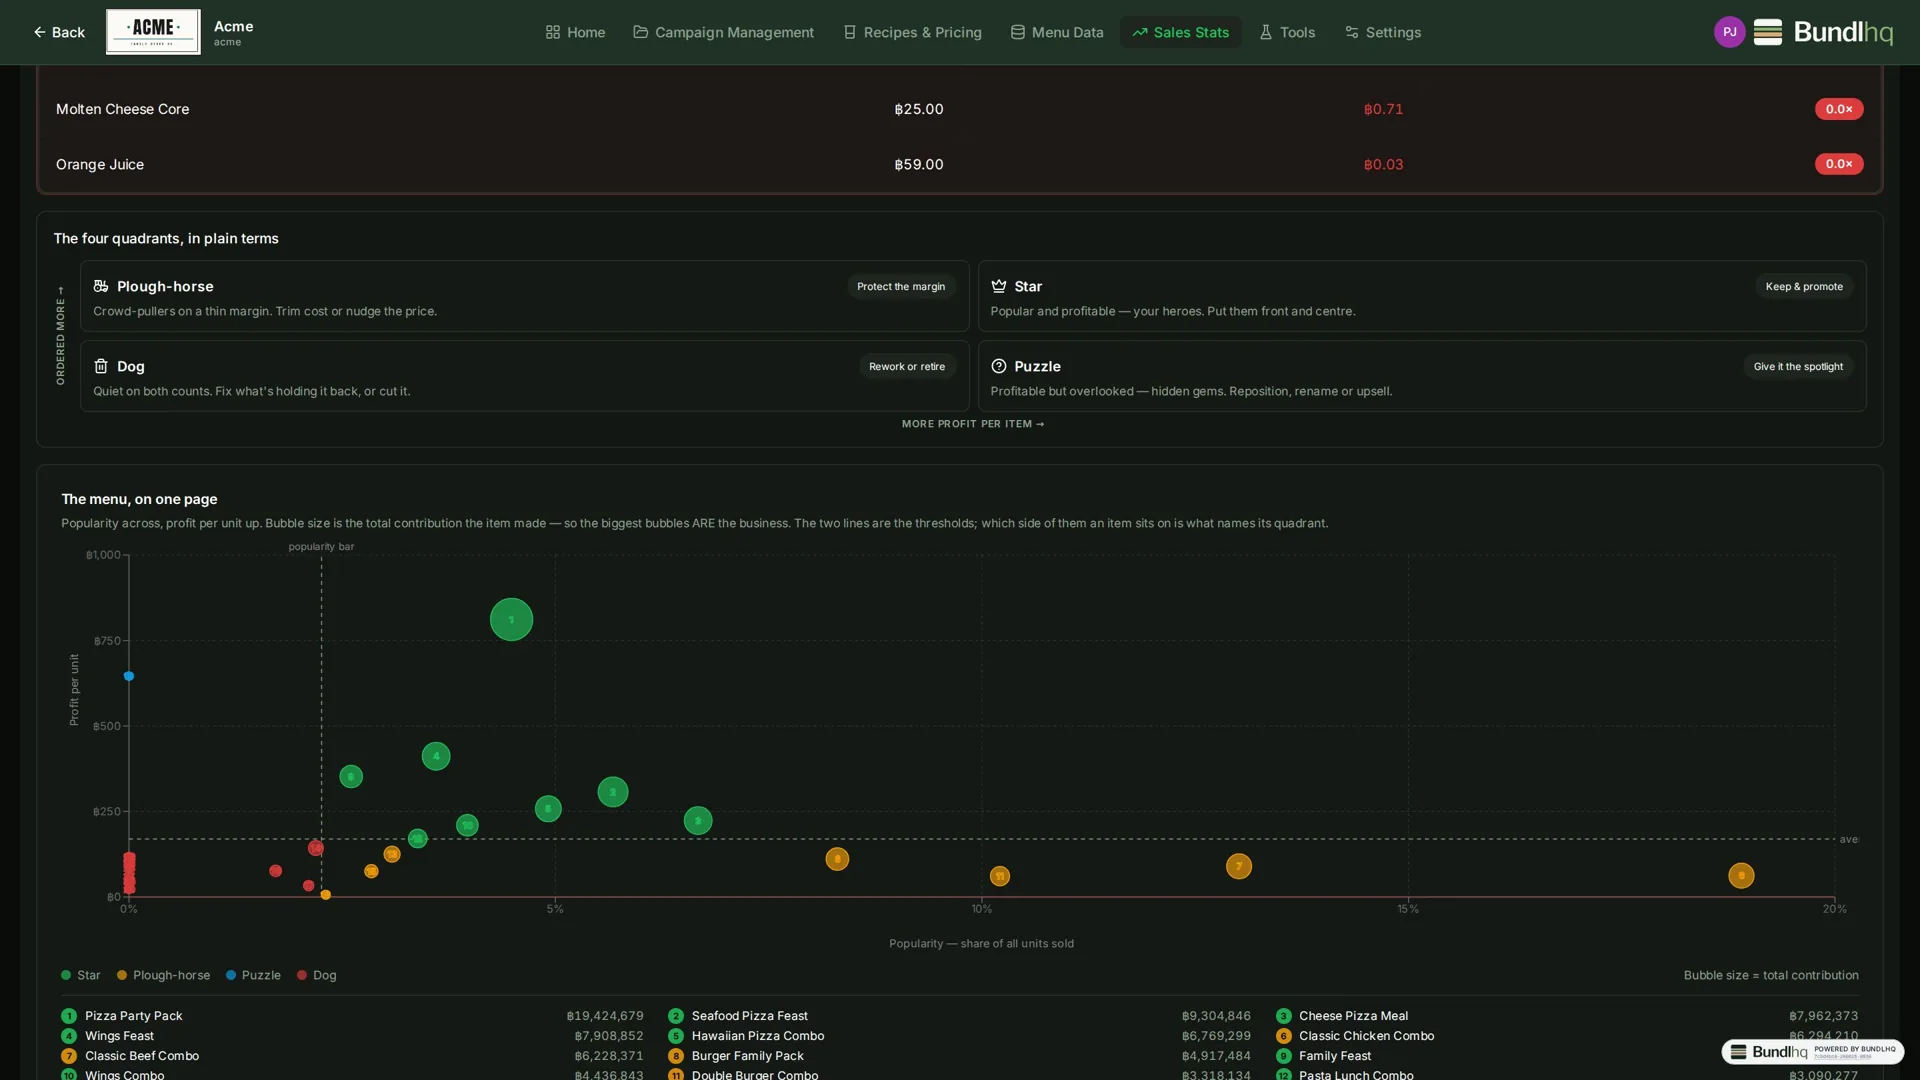
Once your POS sales are imported, Sales Stats turns them into decisions. Menu Engineering plots every item by popularity against margin contribution into the classic Stars / Plow-horses / Puzzles / Dogs quadrants, with the action for each. Campaign Stats estimates a past campaign’s true incremental profit — what it sold that you wouldn’t have sold anyway — netting out sales it took from the rest of the menu. It’s the difference between “the campaign sold a lot” and “the campaign made money”.
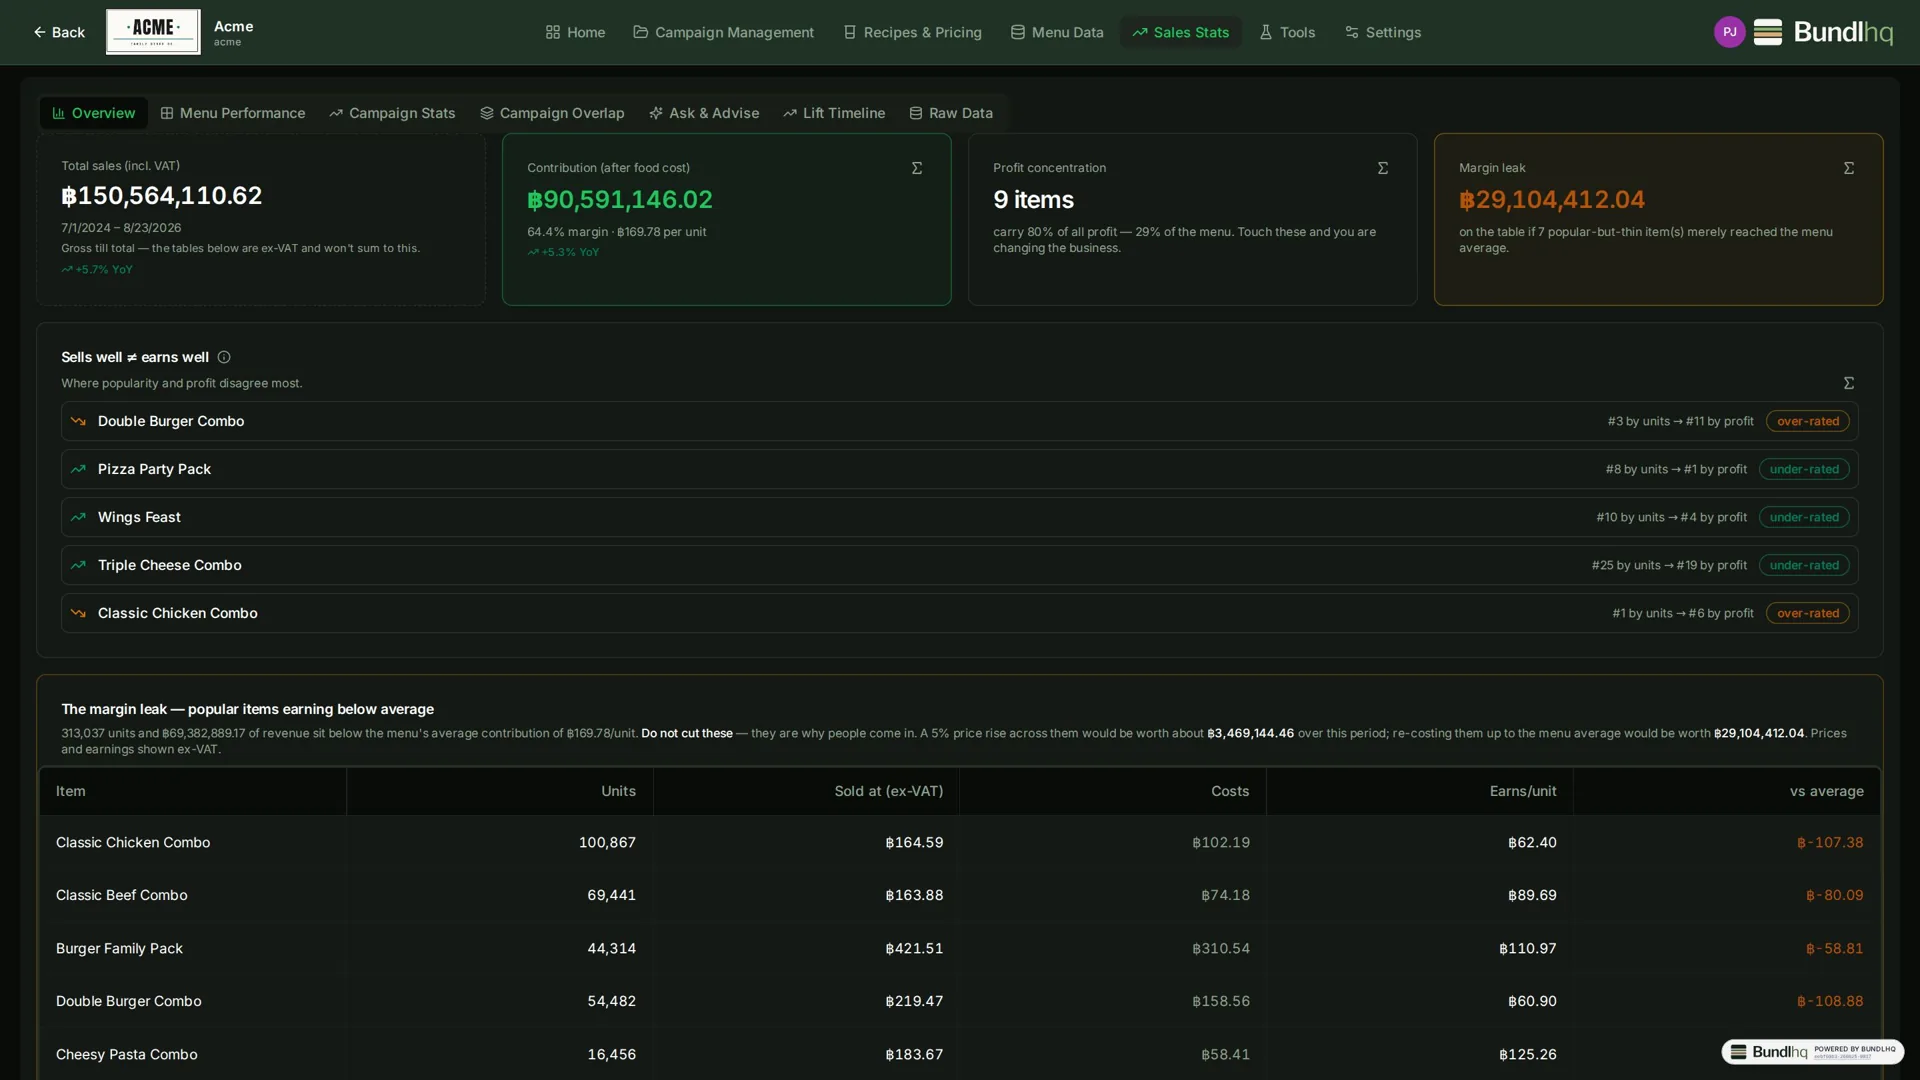
- Sales Overview: headline units and revenue, year on year.
- Menu Engineering: every item plotted by popularity against margin into the classic Stars / Plow-horses / Puzzles / Dogs quadrants — with the recommended action for each.
- Campaign Stats: what a campaign really earned — the profit it added on top of what you'd have sold anyway, net of sales it stole from other items.
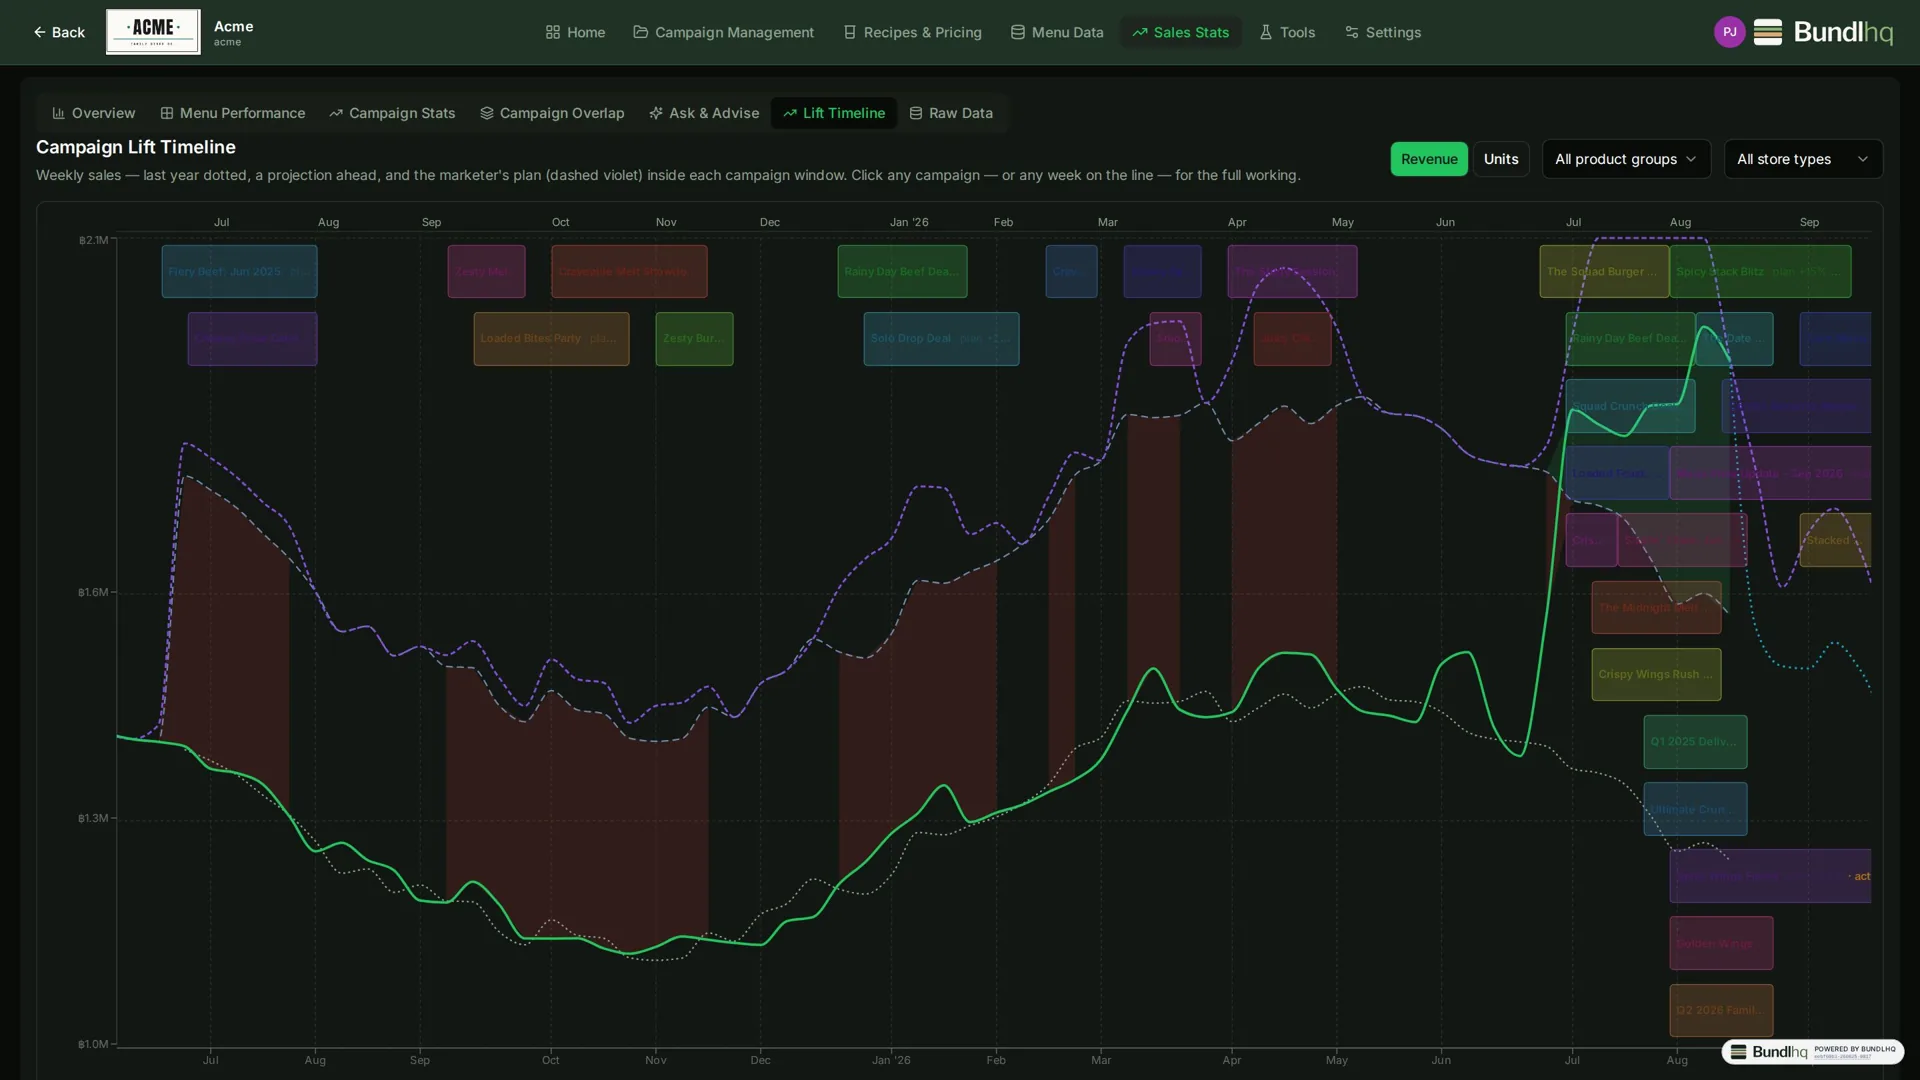
- Lift Timeline: every campaign's measured lift, on one timeline.
- Public holidays flagged in comparison windows, so a lift is never misread.
- Uncosted items are excluded and reported, and the thresholds used are always shown — the analysis never hides its workings.